Two Estates, One Spreadsheet
Two estates in the same English city, a few miles apart. Both mostly social rented, both mostly post-war, both the kind of stock that reaches a board as a single row: number of homes, average band, tenure split, an indicative cost. Read that way they are the same problem twice over. Priced home by home, they are not the same problem at all. And the difference is not the one we expected.
We compiled both from the public record, 305 homes on the first estate and 313 on the second, every home carrying its own record of what it is and what it uses. Then we costed the same work into each one, a fabric package with a heat pump in every home, and put a single question to each home. Does it pay back inside fifteen years?
What the record found
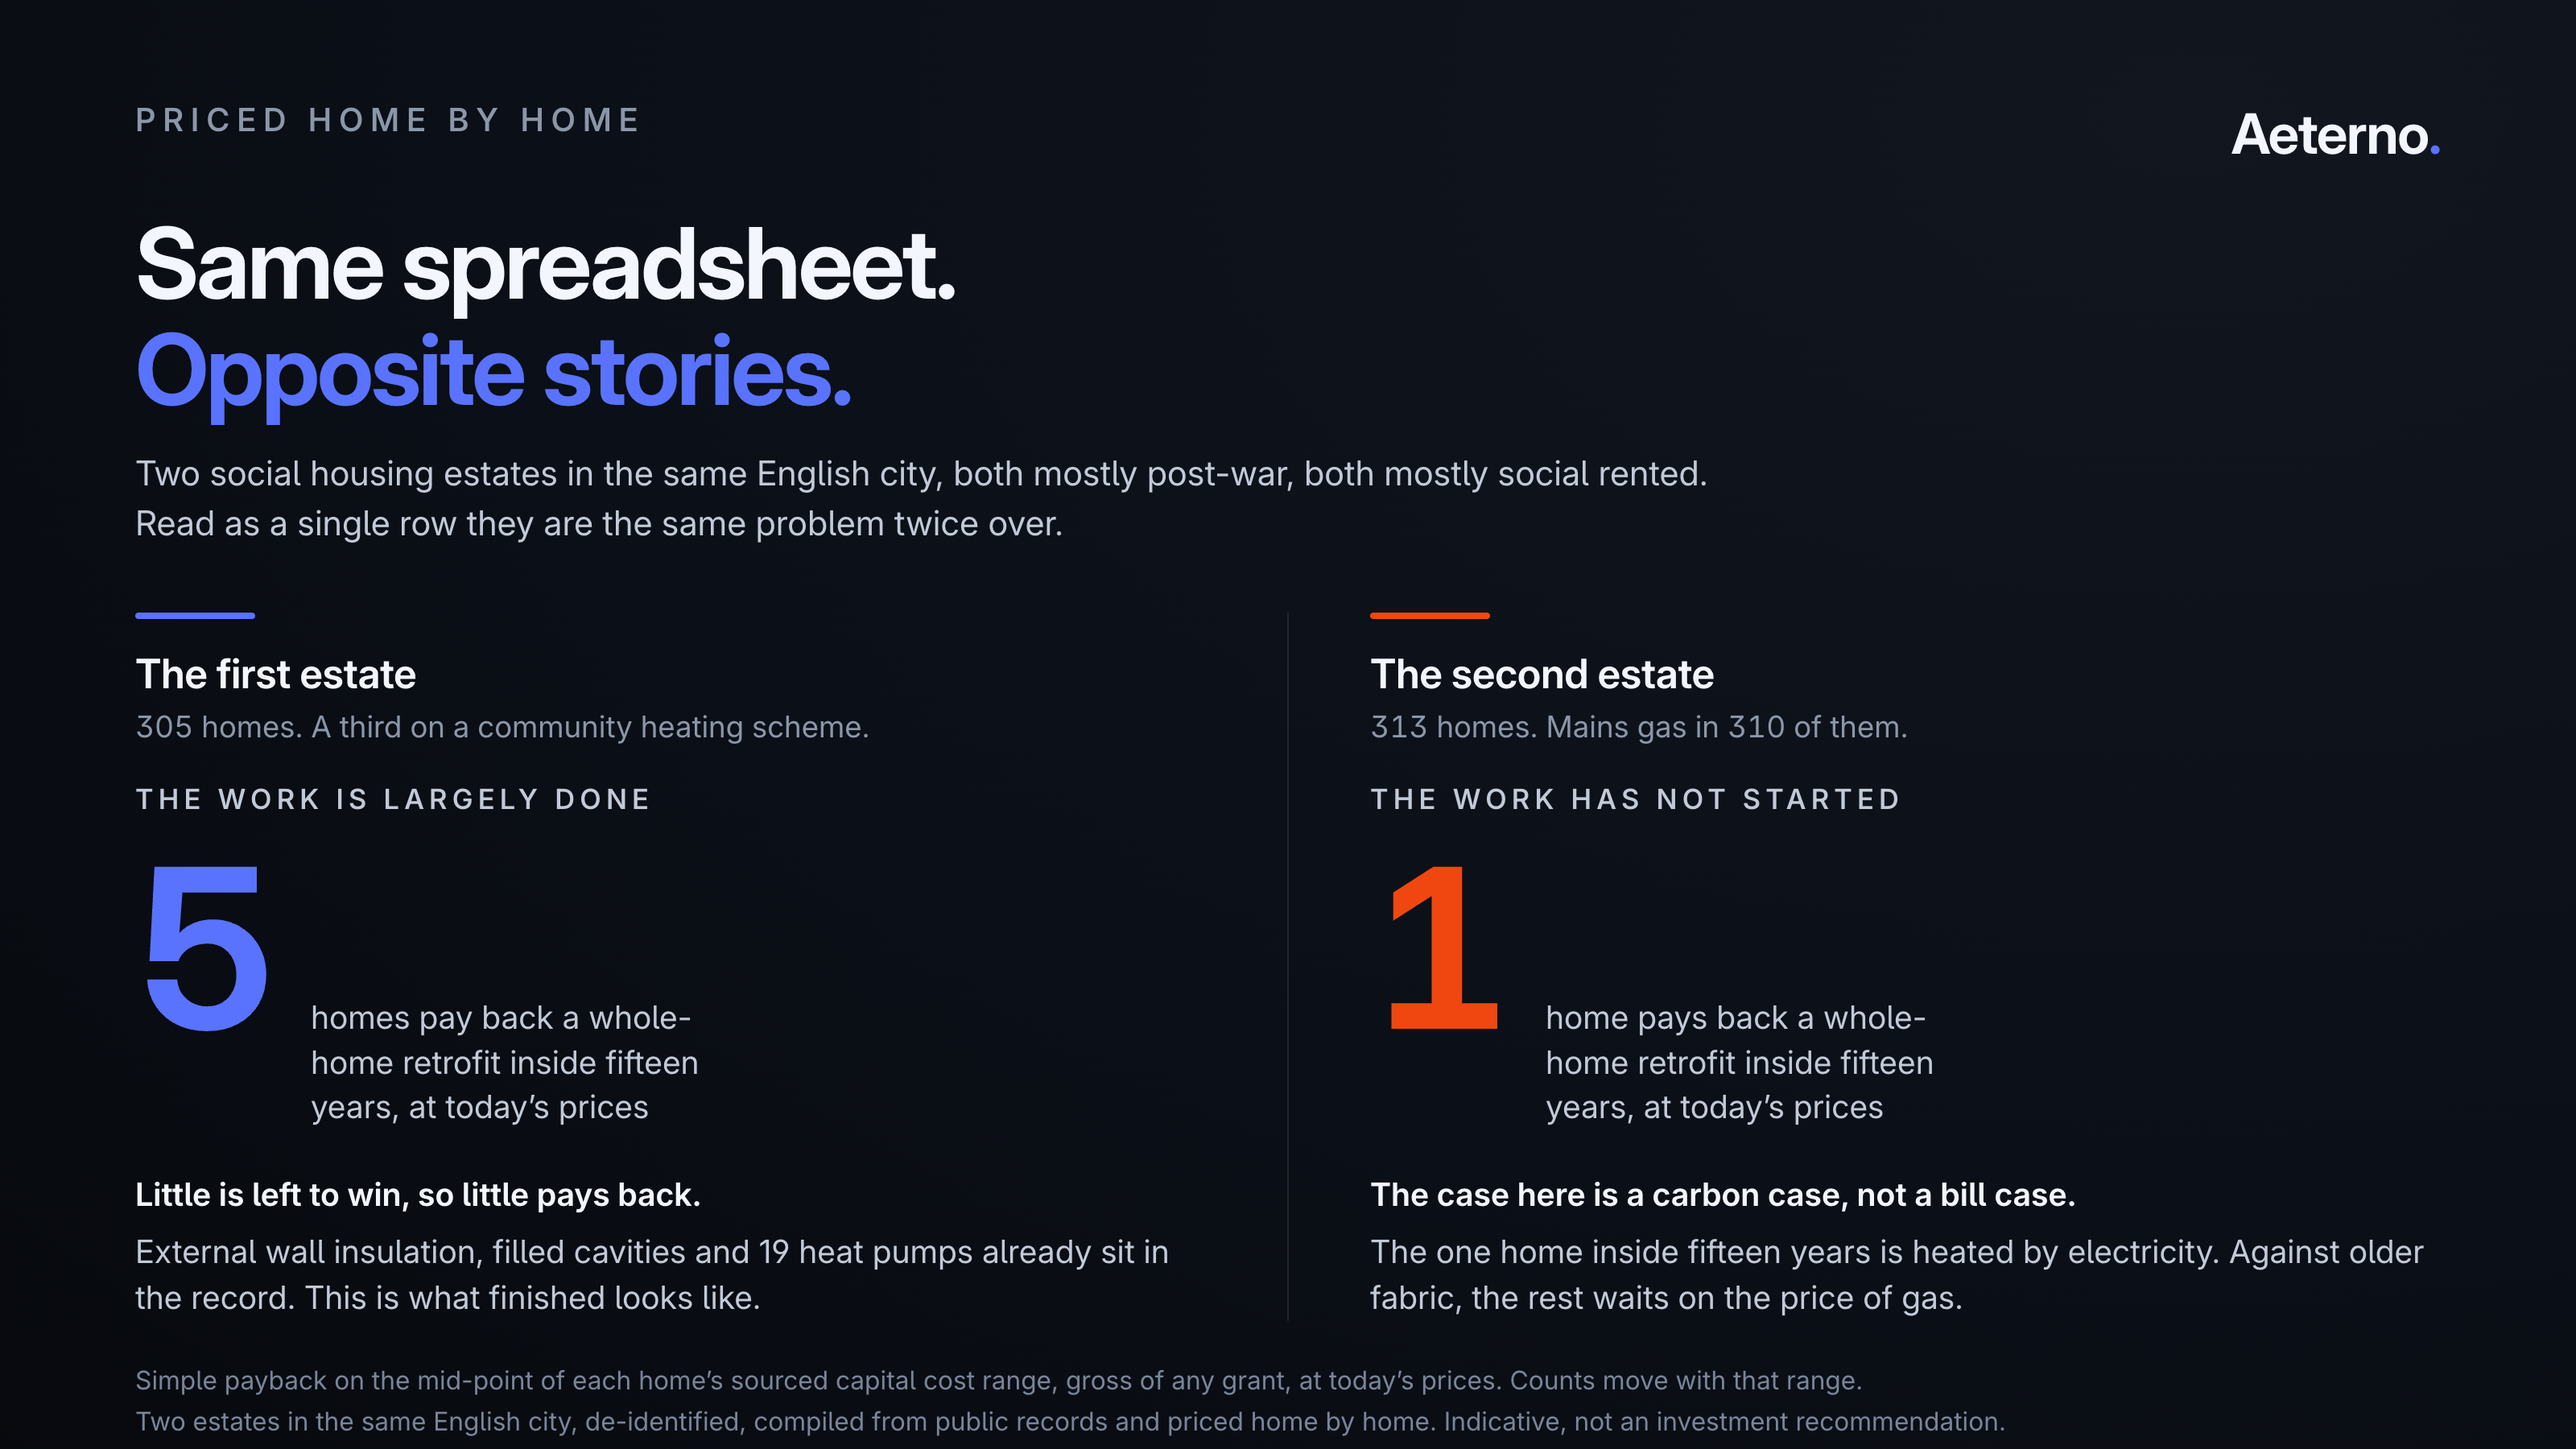
On the first estate, 5 homes do. On the second, one.
Two small numbers, for opposite reasons, and the reasons are the finding. The first estate already did the work. Its record shows system built walls carrying external insulation, filled cavities, 19 heat pumps already in the ground, and a third of the estate on a community heating scheme. Little is left to win, so little pays back. The second estate has not: 310 of its 313 homes burn mains gas, every one of its 191 social rented homes among them, against fabric that is genuinely older. There the work is all still to do, and at today's gas price it pays back slowly, so its case is a carbon case rather than a bill case.
A stock spreadsheet shows two ordinary post-war estates. It cannot see that one of them is what finished looks like and the other has not started.
Then we moved the price
We re-priced both estates under illustrative price futures, taking the gas price from today up to plus 120% and letting electricity follow at a bit over half the gas move. These are not forecasts. They are positions, used to find out how much of each answer depends on the price of gas rather than on the homes themselves.
The first estate climbs one home at a time: 5 today, 27 by double gas, 32 at plus 120%, in 27 separate single home crossings. A queue rather than a threshold, and a short queue, because most of this estate crossed years ago.
The second estate waits, then arrives together. One home today, 35 at plus 120%, and in the middle of that climb 11 homes cross inside a single ten point move in the gas price, at around plus 102 to plus 111% on the midpoint cost. Take the low end of the sourced cost band instead and 42 homes arrive in that same window. On today's public record many of these homes are near identical: the certificates describe the same size, the same construction and the same heating, so the record prices them within pounds of one another and they reach the threshold together. Some of that sameness is real, and some of it is the resolution of certificate level evidence.
Either way the consequence for a programme is binary: order the work at today's prices and the order is either far too small or far too large, and you find that out in one go. Better per home evidence is what turns a step like that into a slope you can plan against.
What decides a gas heated home, throughout, is the distance between the two unit prices rather than the gas price on its own, a little over four to one today. Business cases that only stress test gas going up never see electricity coming down, and it is the same distance either way.
What the record already knows
The practical difference between these two estates is not which one to do. It is that a programme which treats them as the same problem spends its first phase in the wrong place: surveying, scoping and pricing homes that already banked their saving, while the estate that has not started waits behind them.
Telling done from not done, home by home, before anyone books a survey, is a thing the public record can already do. Neither landlord sent us anything.
Where this leaves you
Both estates were compiled from records that are already public, before any conversation, and the same can be done for any place in England.
If you are sizing a programme this year: which of your estates already did the work, and does your spreadsheet know?
About the numbers
- Both estates are de-identified deliberately. The finding is about how two ordinary estates differ, and naming them would turn it into a story about two landlords.
- Every figure is indicative, compiled from the public energy certificate register and open location data. Nothing was measured, no home was visited, and no resident information is used or inferred. None of it is an investment recommendation.
- Payback uses the midpoint of each home's sourced capital cost range, gross of any grant. The low and high ends of that range move the counts, and they move them furthest in the middle of the second estate's range, where the homes are bunched: the ten point window holds 11 homes at the midpoint, 42 at the low end, and 7 at the high end. Any count from that region travels with its band.
- Price futures are illustrative positions, not forecasts. Electricity moves at 0.55 times the gas move, on the basis that a majority of marginal power in Great Britain is still set by gas. Held flat instead, electricity produces much earlier crossings, which is why a flat electricity figure should never travel without that qualifier. The underlying model files publish their own ladders with electricity held flat and stop at plus 100%; these figures apply the stated escalation and extend to plus 120%.
- Simple payback throughout. No discounting, no carbon price, no maintenance difference, no residual value, and each future is held constant rather than run as a path.
- These figures replace those first published on 28 July, corrected on 30 July after we found and fixed a data processing fault. Every figure above has been independently recomputed.