Views
Real readings, worked from public records. One question per view, every assumption on the page, every number verified before publication. Public data only; a customer's own views live in the product.
For householders
One home, read against the record it already sits in.
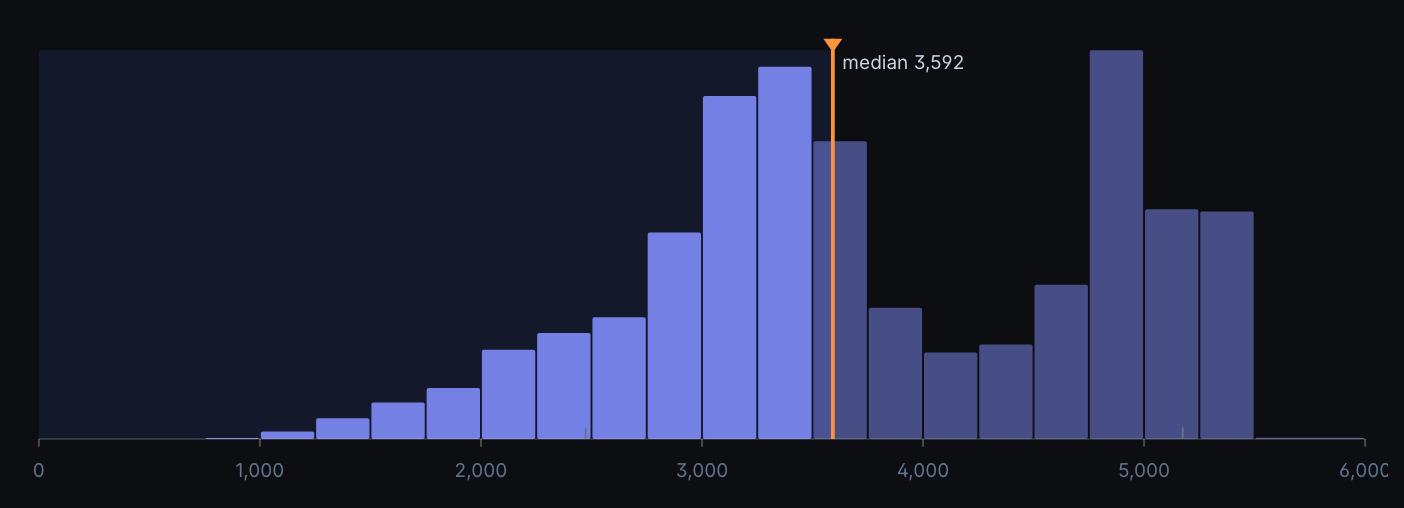
Where does your home sit on the curve?
107,336 homes by the hours their heating is modelled to run: a two-humped curve, not a single number. Move the marker to read where any home sits.
Open the view →
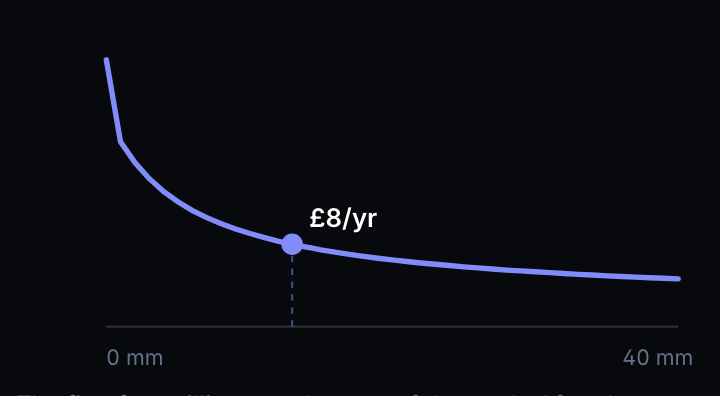
What is the pipe outside your wall costing you?
The heat a bare outdoor pipe sheds all winter, priced live with your own electricity rate. The first few millimetres do most of the work.
Open the view →
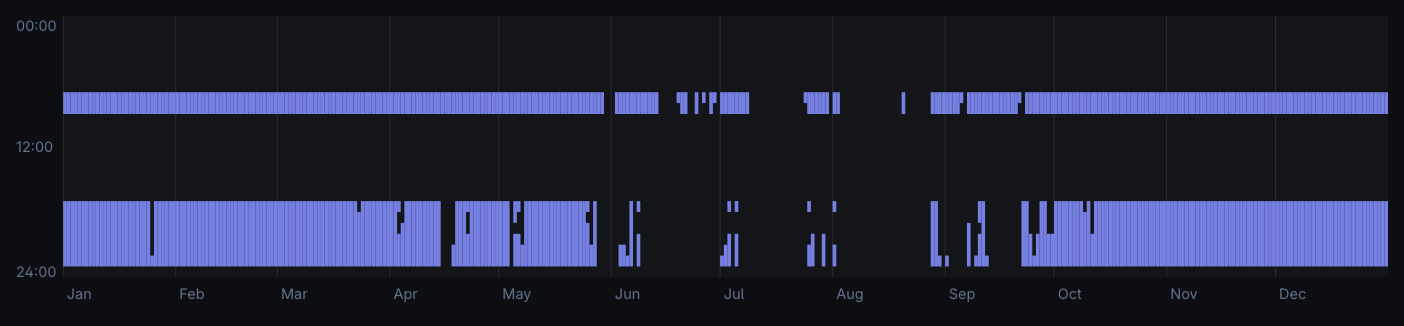
What does a year of heating look like?
A typical year for five kinds of British home, hour by hour: 8,760 hours, marked wherever the heating runs.
Open the view →
For housing & place
A whole stock at once, one question asked of every home.
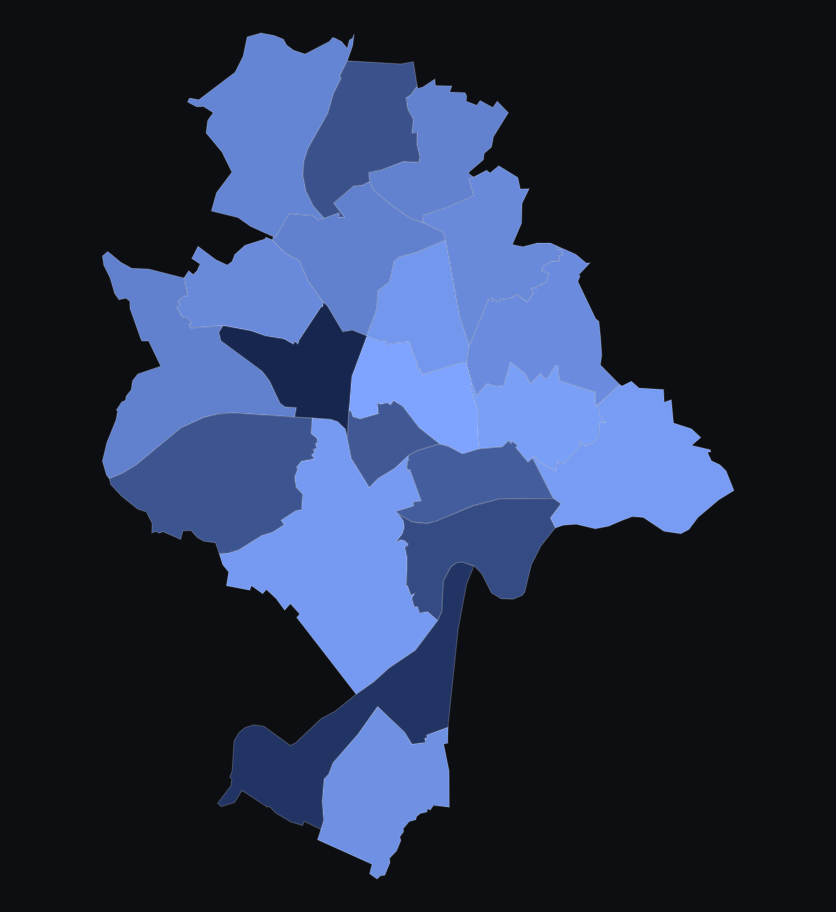
Where does a city's invisible heat go?
The 107,336 Nottingham homes the public record lets us price, asked one question at once. Choose the scenario and watch every ward answer.
Open the view →
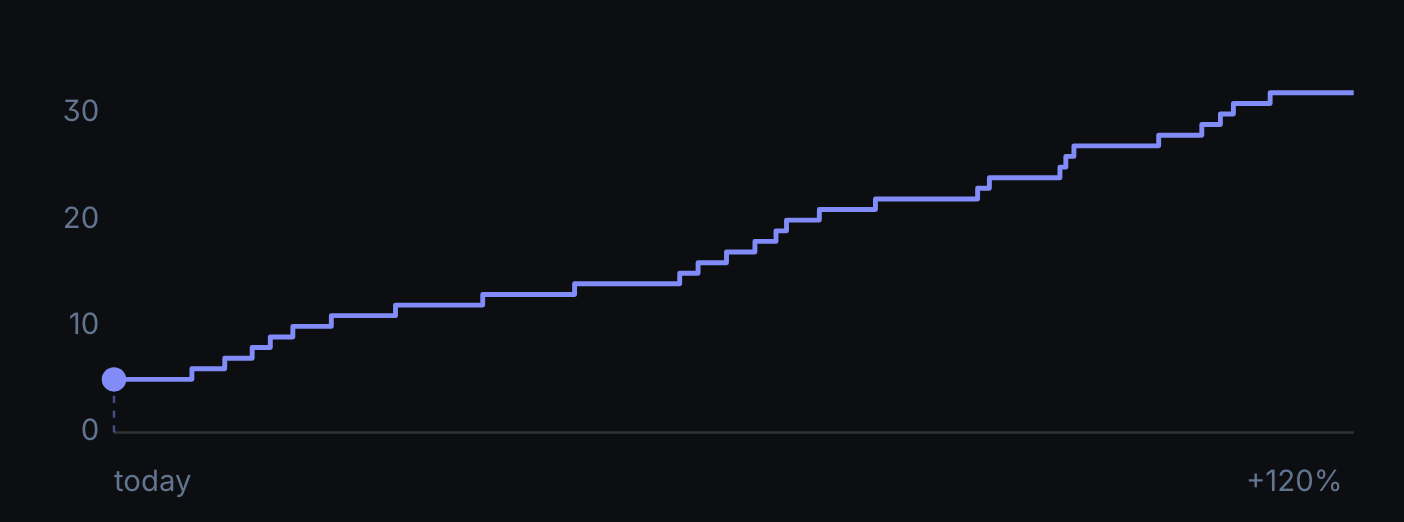
When does a refit pay?
One social housing estate of 305 homes under a rising gas price. The payback queue forms one home at a time; the estate average never joins it.
Open the view →